Gurara Reservoir · Kaduna State, Nigeria
Twenty-five years of water change, made visible.
A satellite-led evidence platform for understanding Gurara Reservoir’s surface-water history, seasonal behaviour and climate-conditioned outlook.
- Study record
- 2001–2026
- Valid observations
- 196 months
- Forecast horizon
- To 2030
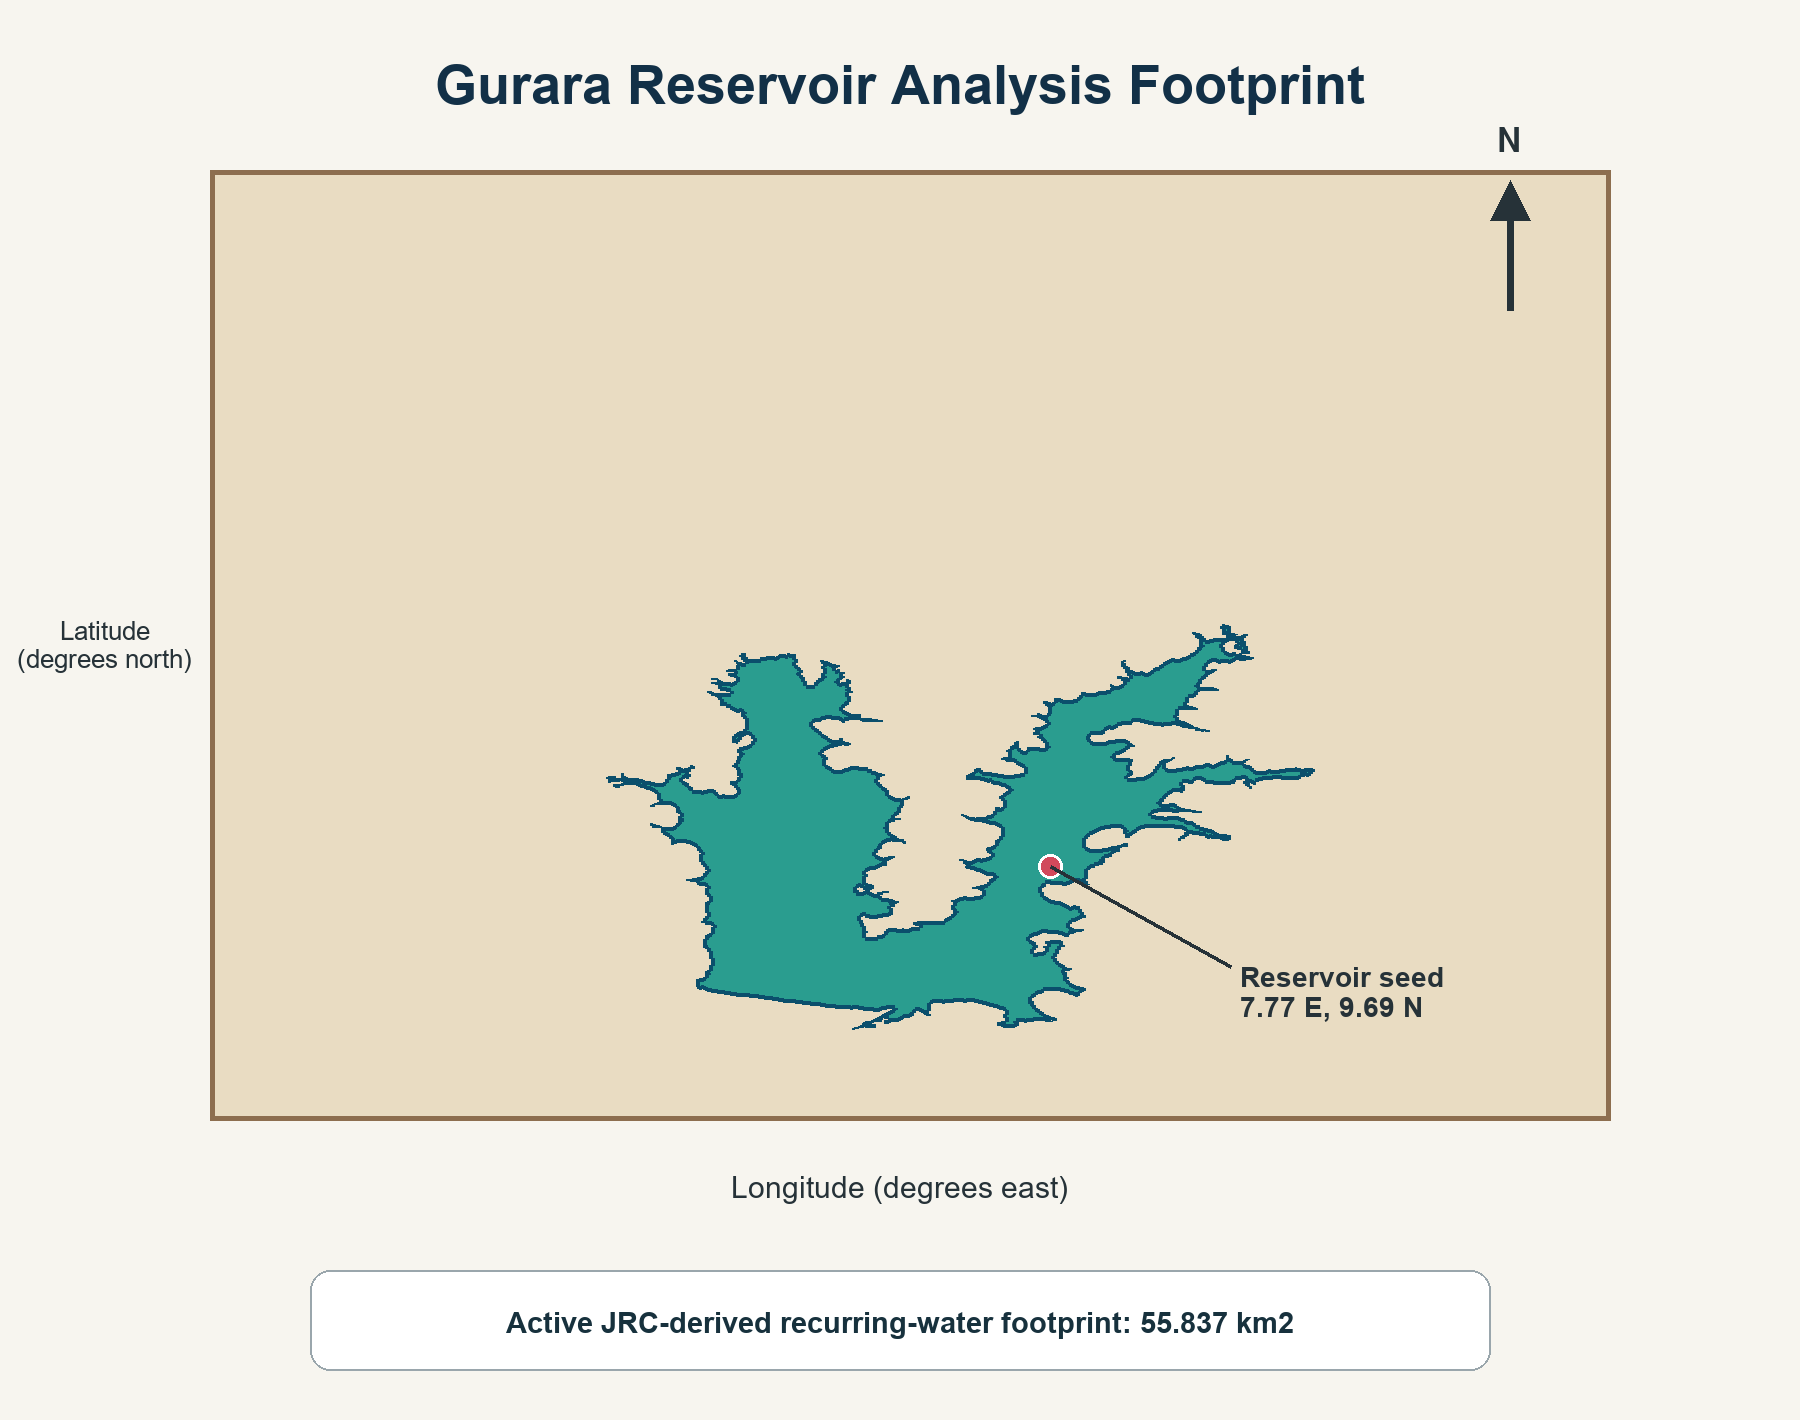
Study area55.84 km² recurring-water footprint
Latest observationApril 2026
36.81 km²visible surface-water area
Above normal34.9% above the April mean
Area is not storage volume.
The evidence
A reservoir shaped by formation, season and climate.
The record shows a significant long-term increase, but the dominant structural change is the reservoir’s formation after 2001—not climate change alone.
Historical record
Monthly surface-water area
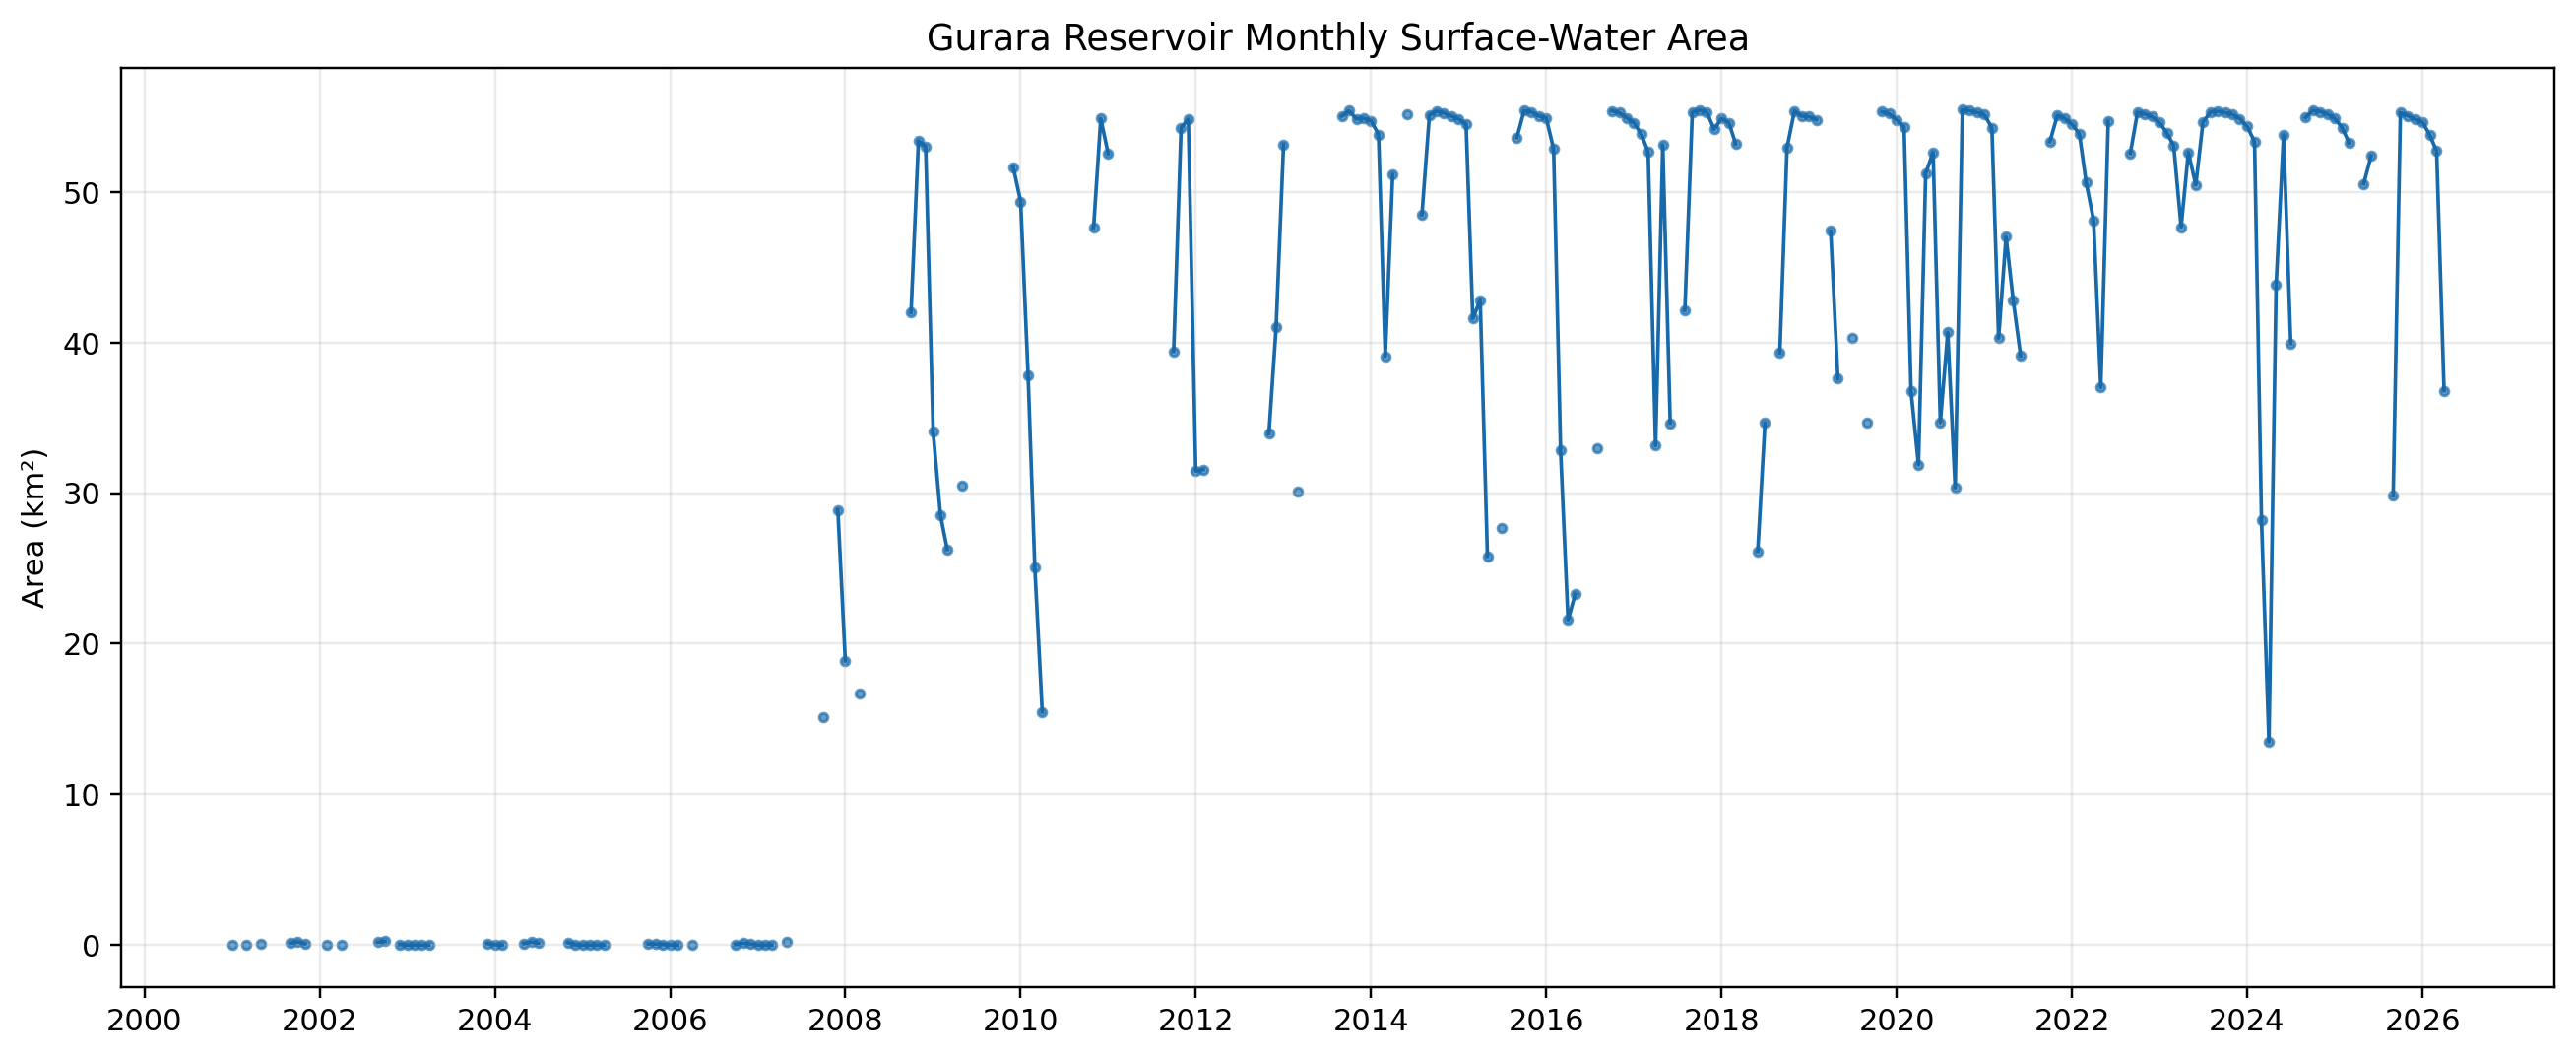
“The reservoir has grown, but the record is also the story of its creation.”
Any interpretation of the positive trend must account for the transition from a natural drainage basin to an impounded water body.
Annual summary
Observed change by year
Annual mean and observed range. The long-term trend includes the reservoir-formation period.
Seasonal pattern
When water extent is highest
April has the lowest historical mean; August has the highest. Monthly sample counts differ because of cloud filtering.
Observe the change
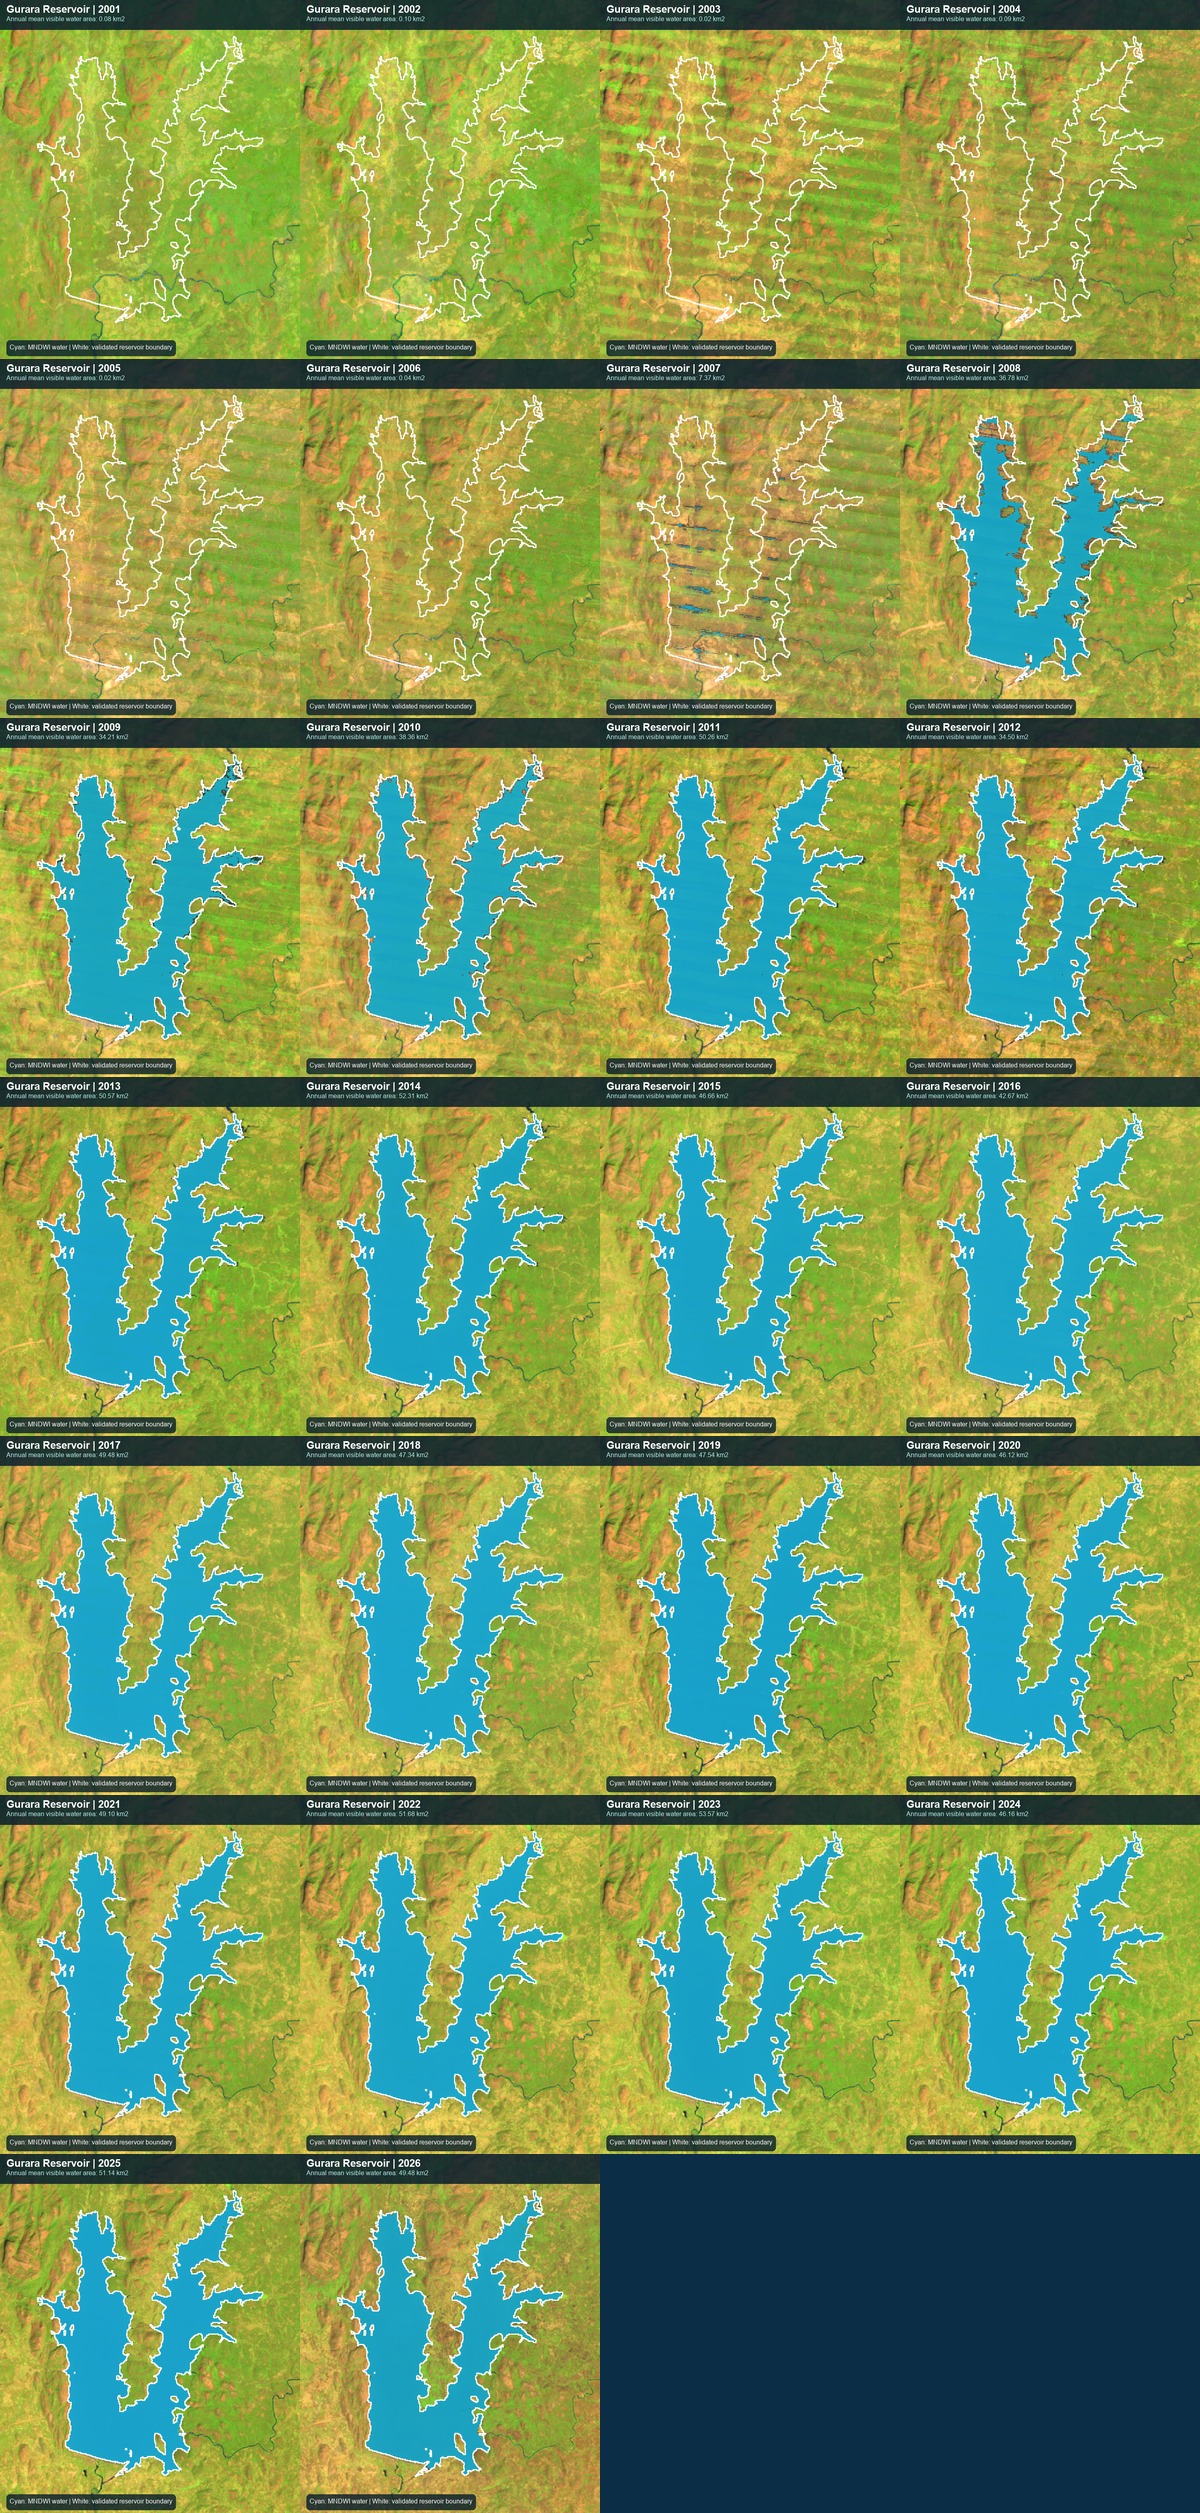
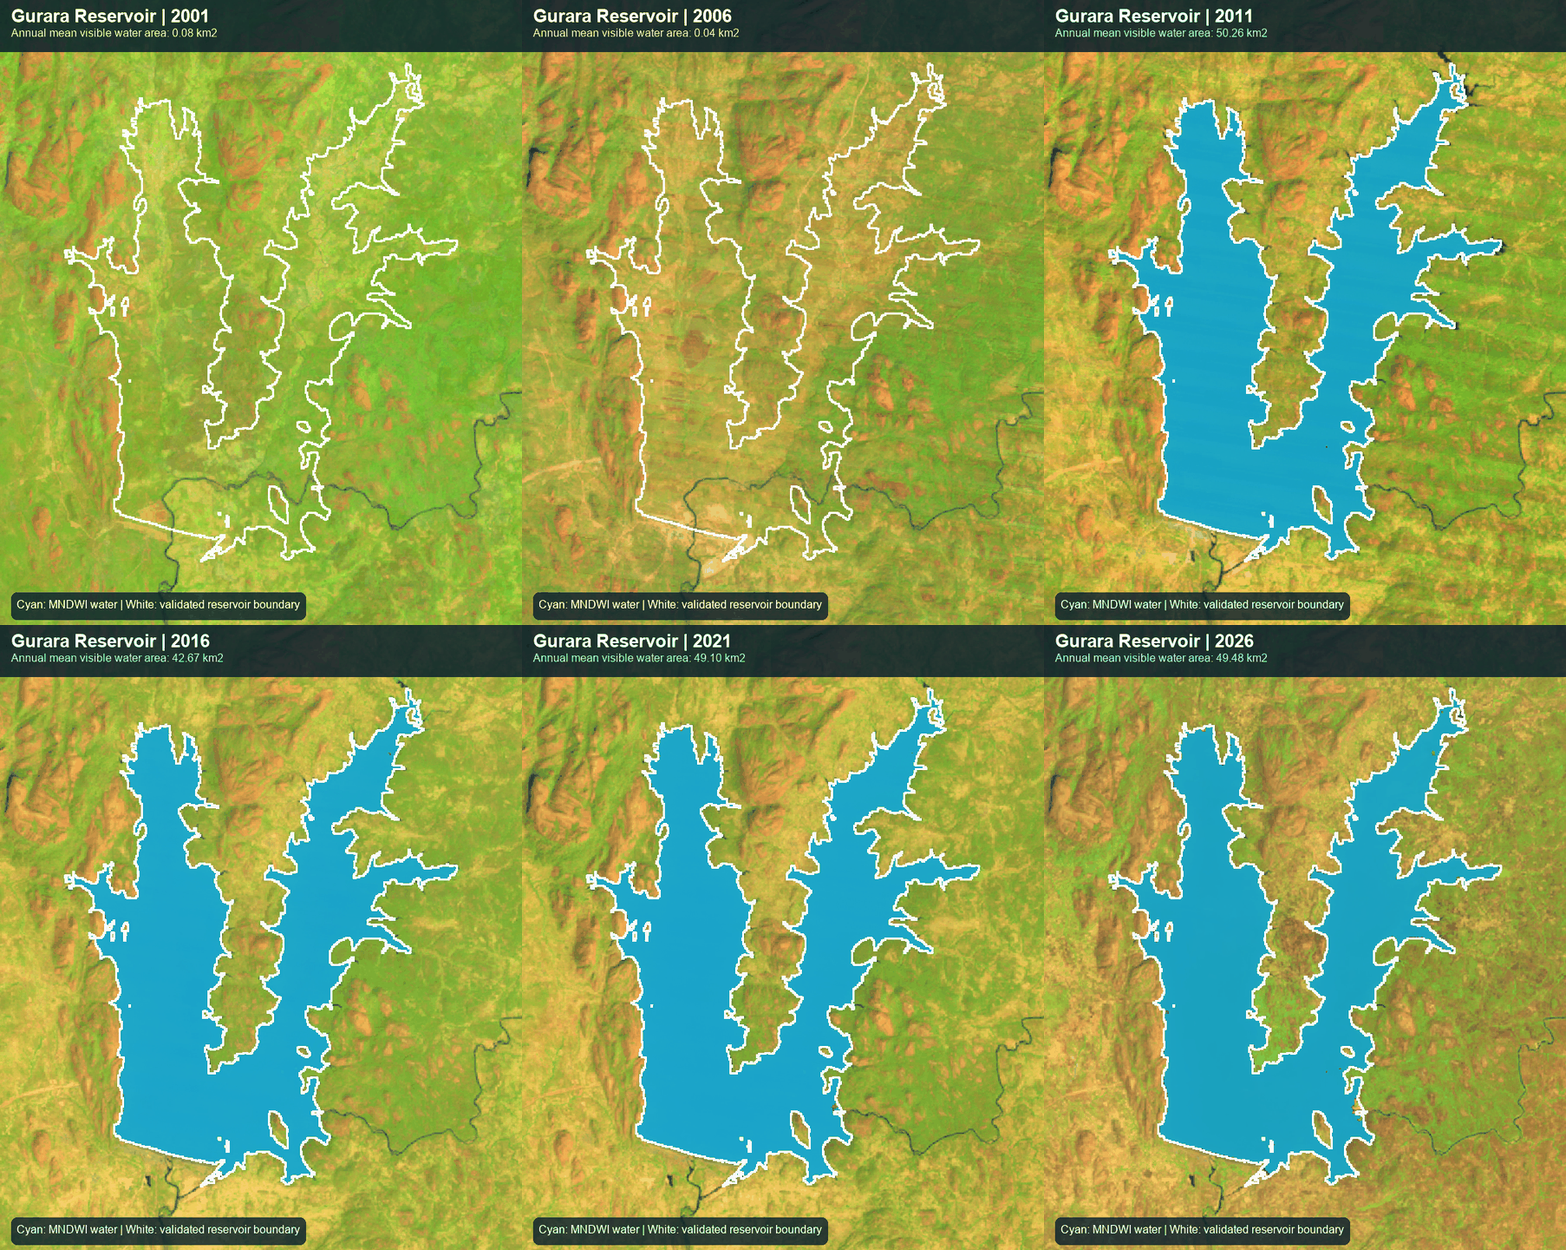
One frame for every year.
The annual Landsat sequence reveals the reservoir forming and then settling into a cycle of seasonal expansion and contraction.
20012026
Climate relationships
Association is evidence—not causation.
Same-month climate relationships are exploratory. Reservoir operations, abstraction, formation history and delayed runoff responses can also influence water extent.
Correlation analysis
Climate and surface-water area
Model interpretation
Random Forest feature importance
Permutation importance varies by forecast horizon and should be interpreted cautiously because tree-model test skill was limited.
Model evaluation
Complex AI did not automatically win.
Persistence, seasonal persistence, SARIMA, Random Forest and XGBoost were evaluated chronologically. Simple models remained competitive at longer horizons.
Test-period performance
Best model by horizon
| Horizon | Selected model | RMSE | MAE | NSE | KGE |
|---|---|---|---|---|---|
| 1 month | SARIMA | 8.014 | 5.393 | 0.075 | 0.516 |
| 3 months | SARIMA | 9.648 | 7.011 | −0.341 | 0.317 |
| 6 months | Seasonal persistence | 9.836 | 5.029 | −0.292 | 0.088 |
| 12 months | Persistence | 9.836 | 5.029 | −0.292 | 0.088 |
Values are in km² where applicable. Negative NSE indicates performance below a test-period mean benchmark.
Forecast and scenarios
Near-term guidance, long-term uncertainty.
SARIMA provides the strongest short-horizon result. Beyond April 2027, projections should be read as planning scenarios rather than precise forecasts.
Forecast peak55.64 km²December 2026
Forecast endpoint40.94 km²April 2027
Best short modelSARIMA8.01 km² test RMSE
Selected horizons
Operational forecast values
| Horizon | Month | Area | Lower 95% | Upper 95% |
|---|---|---|---|---|
| 1 | May 2026 | 41.890 | 29.449 | 54.331 |
| 3 | Jul 2026 | 42.992 | 26.009 | 55.837 |
| 6 | Oct 2026 | 53.645 | 34.536 | 55.837 |
| 12 | Apr 2027 | 40.936 | 19.735 | 55.837 |
Mapped uncertainty
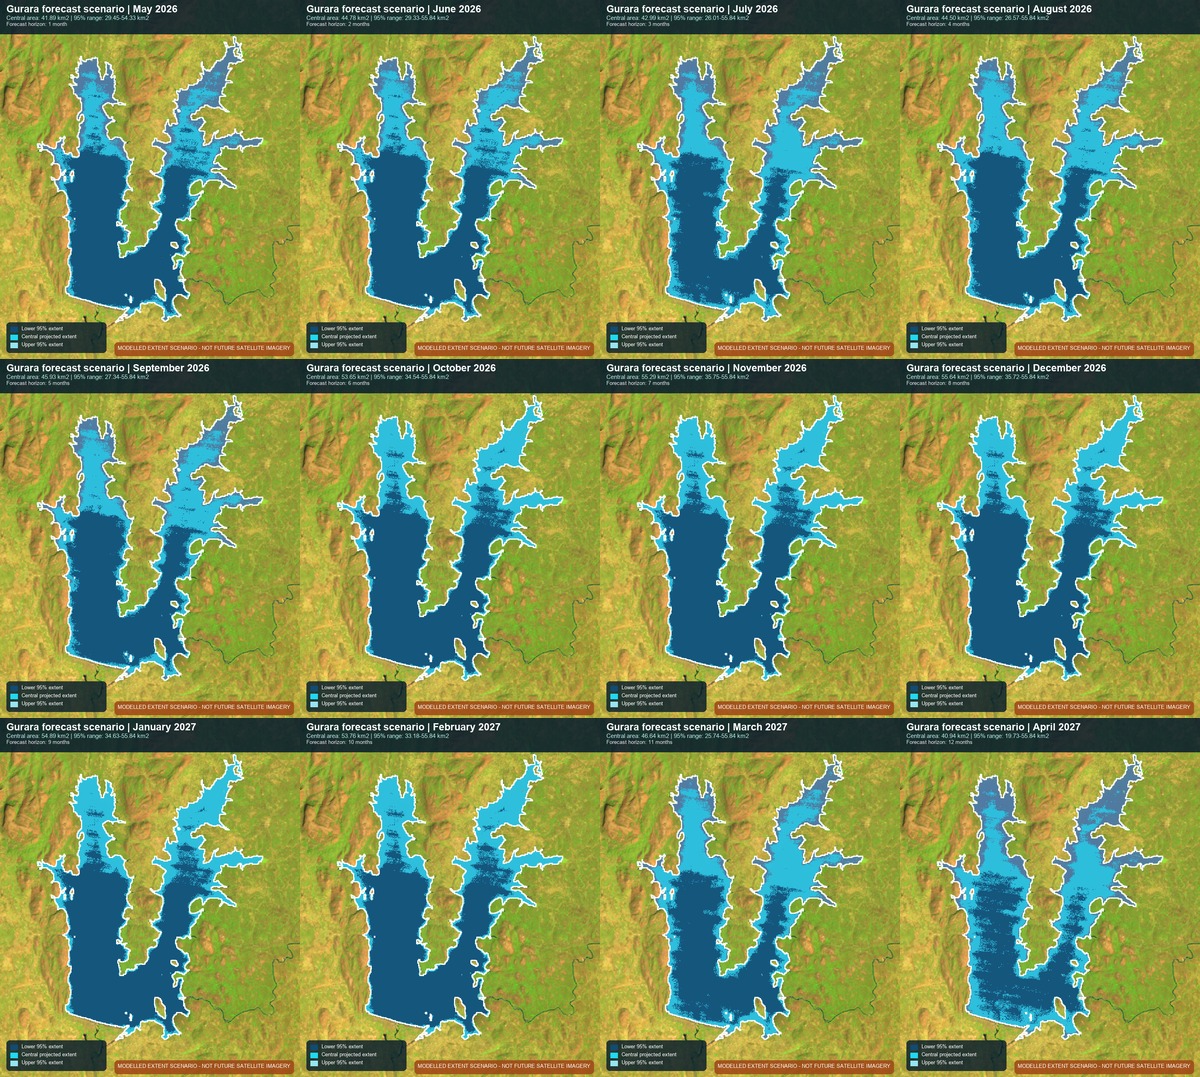
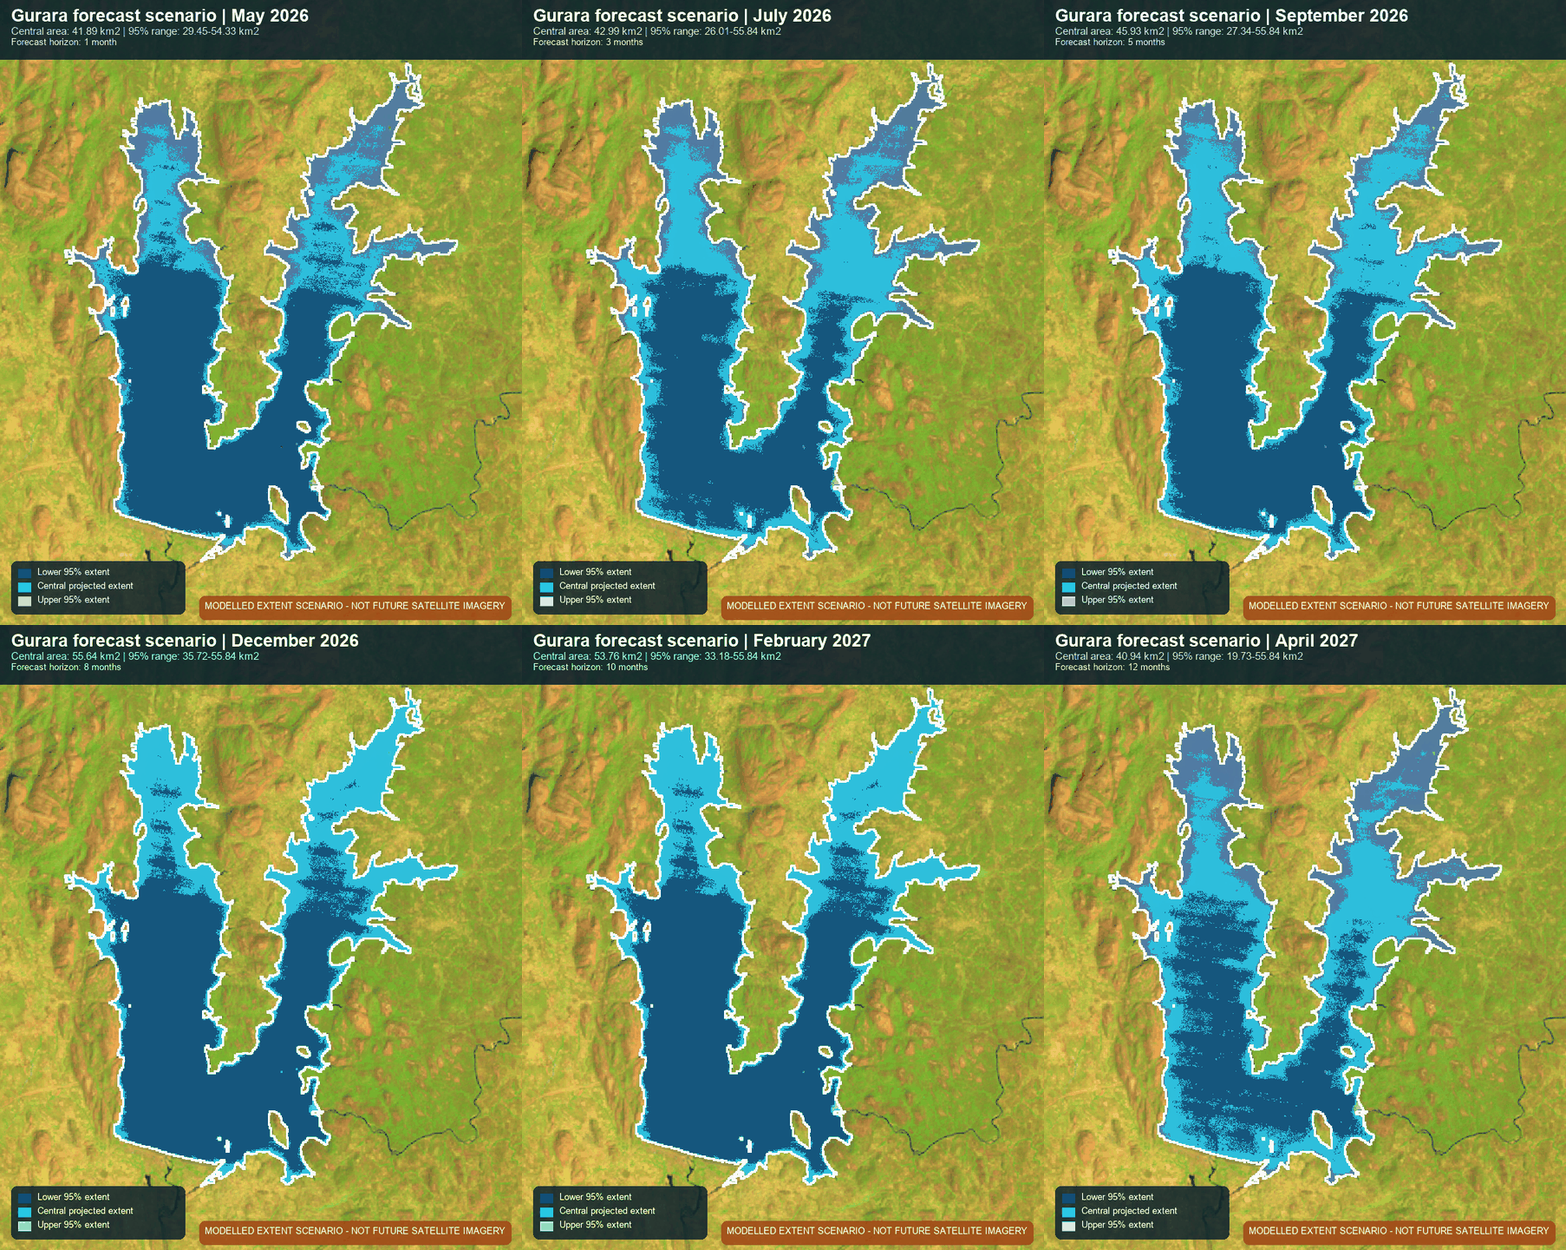
A plausible spatial extent—not an exact shoreline
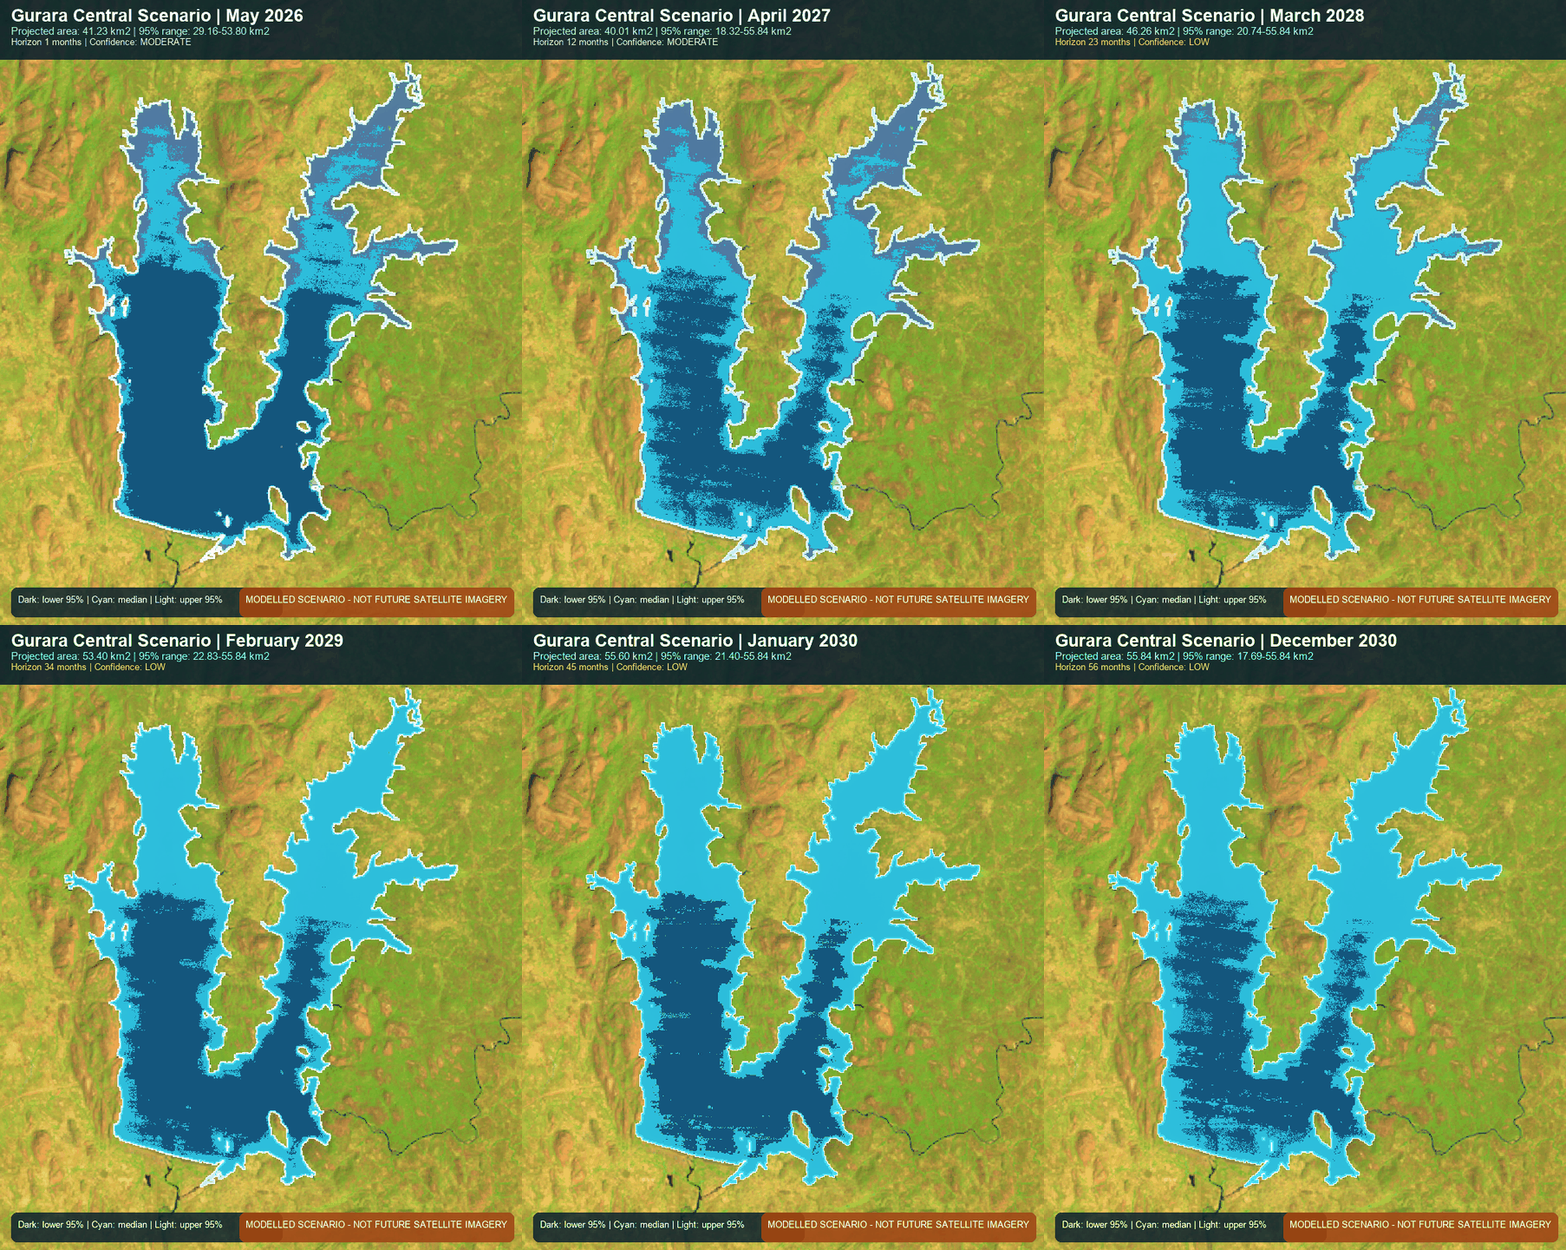
Dark blue shows the lower 95% extent, cyan the central projection and light blue the upper 95% extent.
Climate-conditioned outlook
Explore scenarios through 2030
The central case holds climate stress multipliers unchanged and provides the core planning trajectory.
- 2030 annual mean
- 50.12 km²
- Rainfall adjustment
- No change
- Temperature adjustment
- No change
Projection atlas
Uncertainty, seasonality and climate-model spread
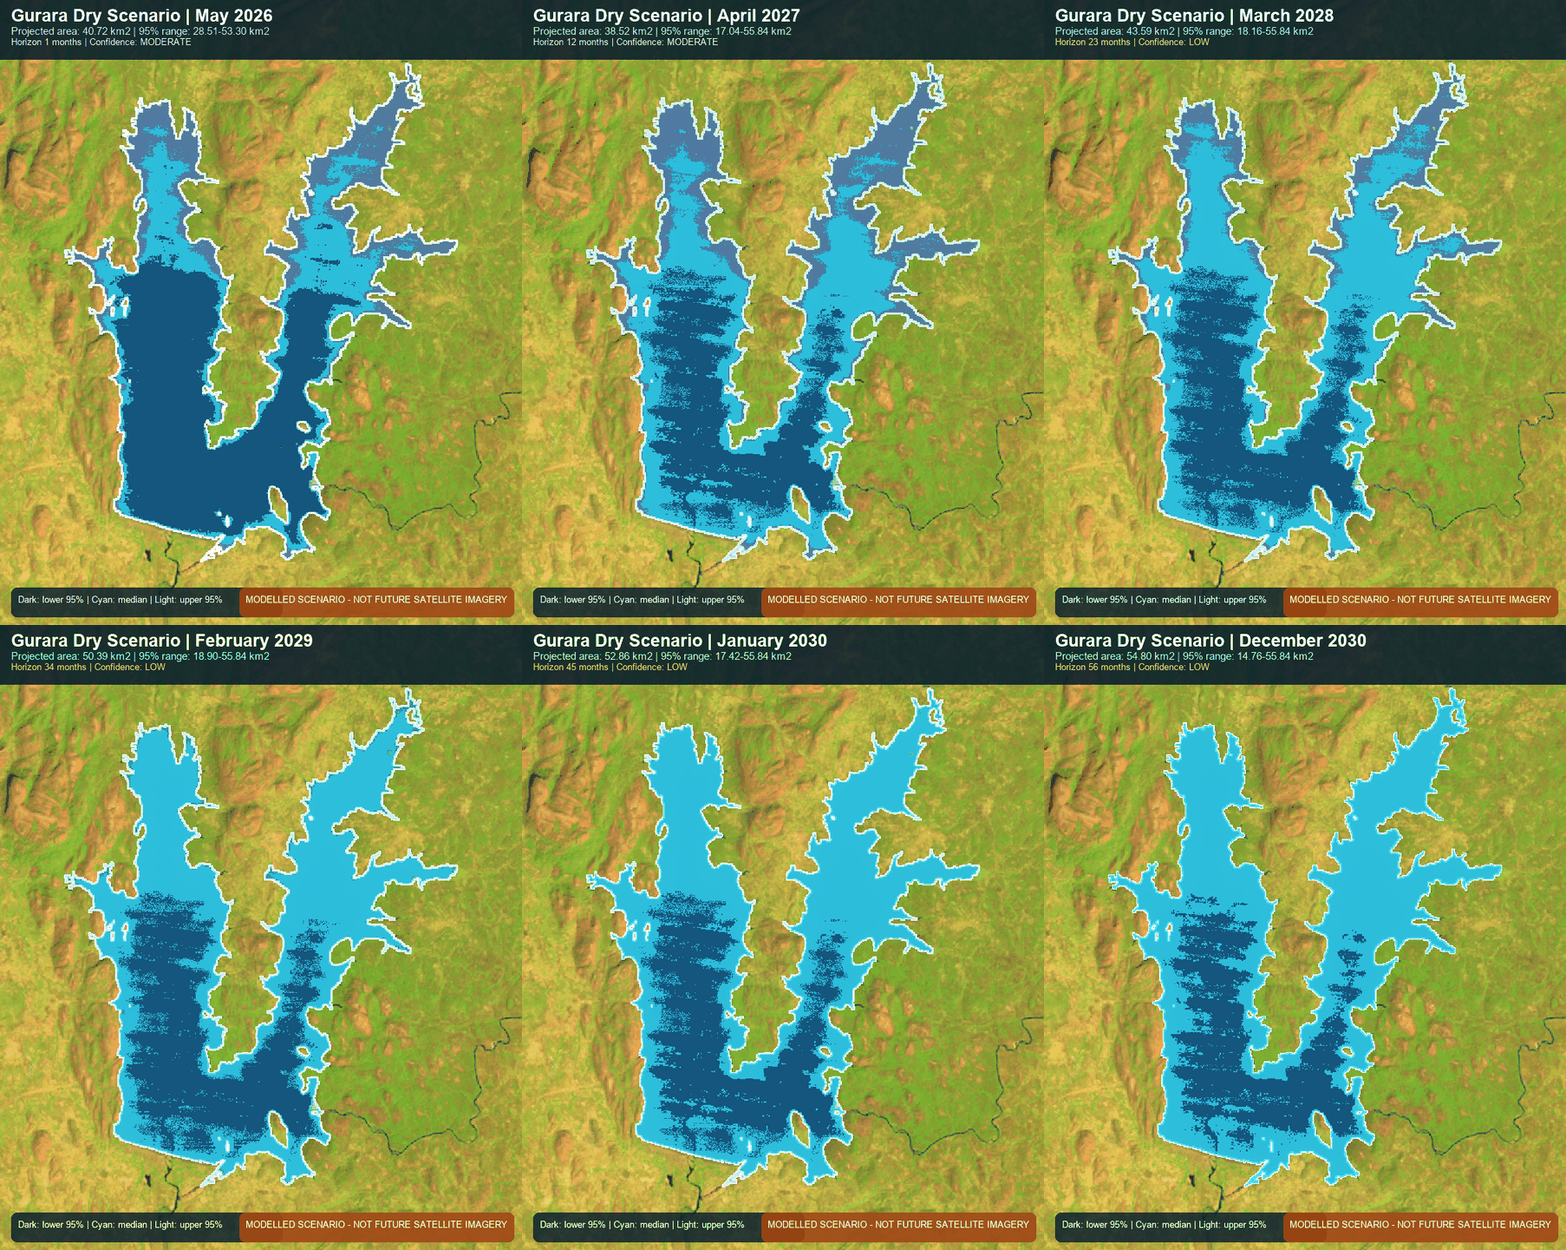
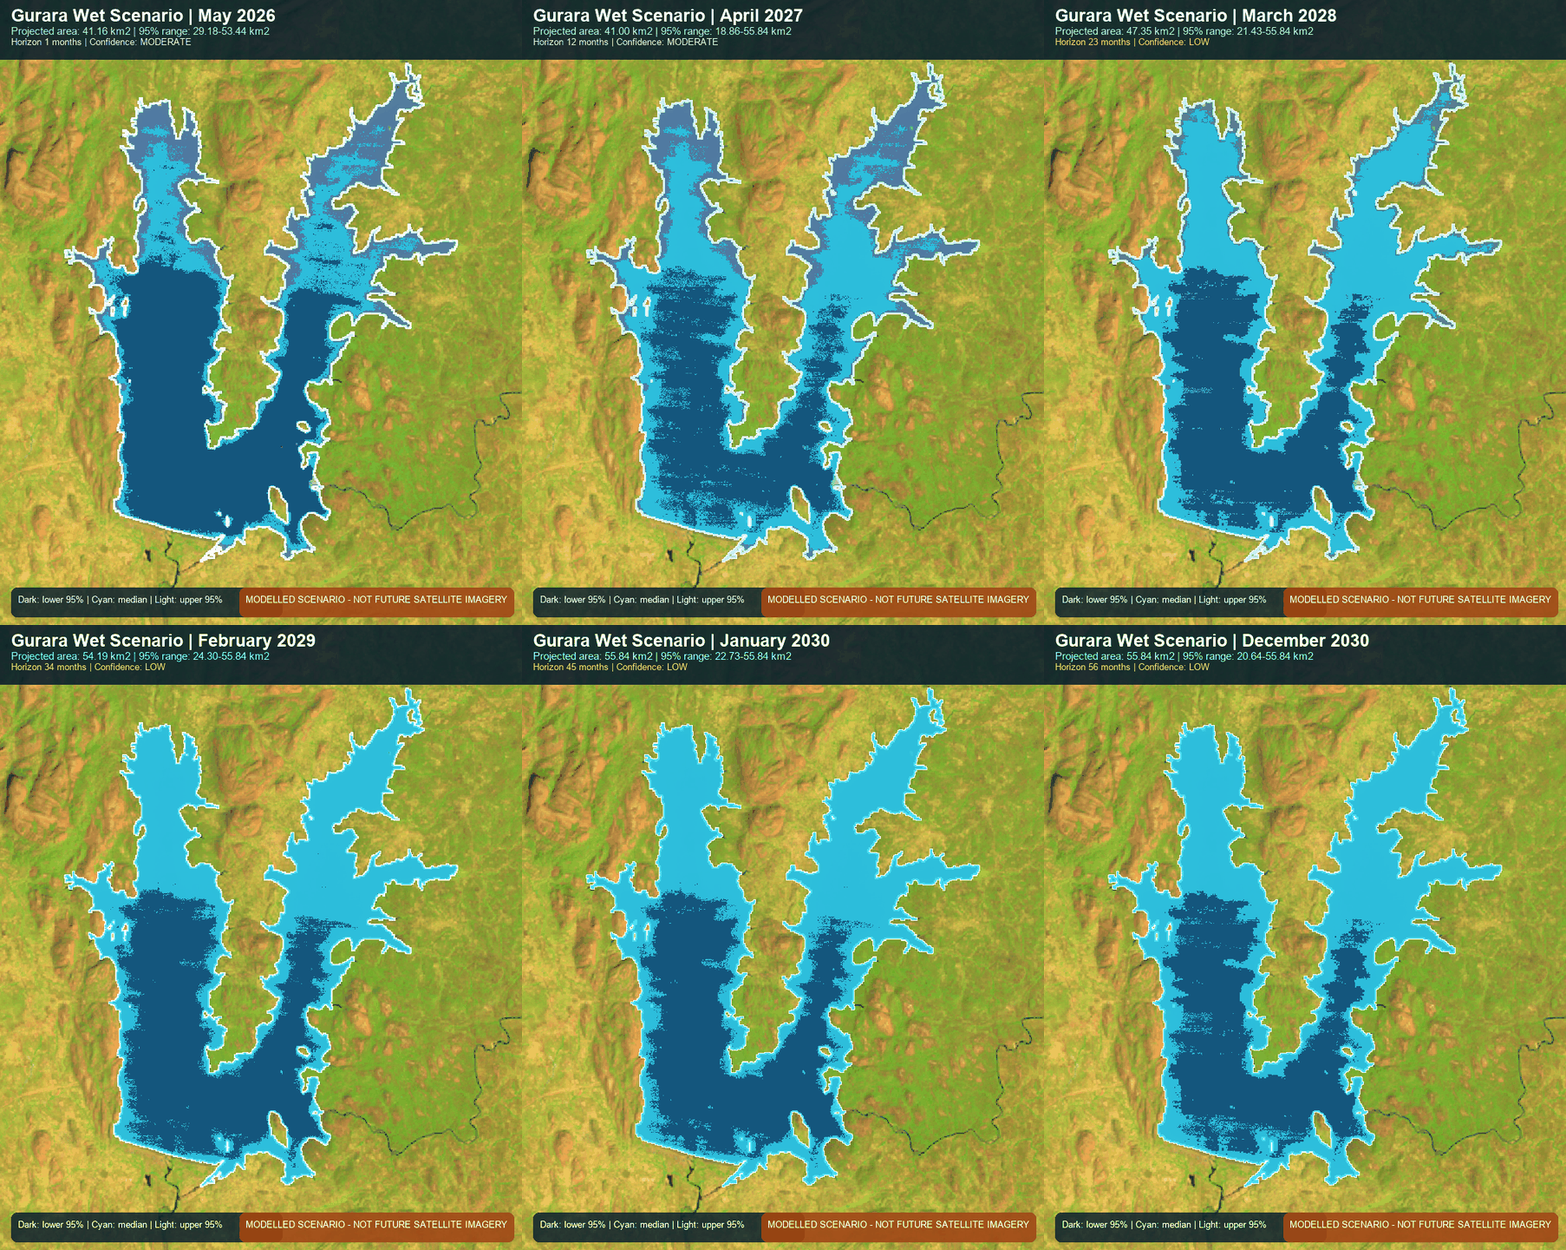
Five bias-corrected NEX-GDDP-CMIP6 models under SSP2-4.5 and SSP5-8.5 inform these scenarios. Results after April 2027 are low-confidence planning scenarios.
01
Monthly scenarios through 2030
Central 80% and 95% intervals widen substantially with horizon.
02
Annual scenario means
03
Projected climate inputs
04
Uncertainty growth
05
Projected seasonal cycle
06
Scenario differences
07
Scenario heatmap
08
CMIP6 ensemble spread
09
Projected water balance
10
History and projection
The observed record and central projection share one view to make the forecast origin explicit.
Scenario definitions
Documented stress tests
| Scenario | Rainfall | PET | Temperature |
|---|---|---|---|
| Central | 1.000 | 1.000 | 0.0 °C |
| Dry | 0.850 | 1.100 | +1.0 °C |
| Wet | 1.150 | 0.950 | −0.5 °C |
December 2030
Scenario outcomes
| Scenario | Median | Lower 80% | Upper 80% | Lower 95% | Upper 95% |
|---|---|---|---|---|---|
| Central | 55.837 | 31.481 | 55.837 | 17.695 | 55.837 |
| Dry | 54.797 | 27.983 | 55.837 | 14.763 | 55.837 |
| Wet | 55.837 | 35.005 | 55.837 | 20.639 | 55.837 |
Research design
From satellite pixels to decision evidence.
A reproducible workflow connects Earth observation, climate records, validation, forecasting and uncertainty communication.
- 01
Define
Derive a recurring-water reservoir footprint from JRC Global Surface Water.
- 02
Observe
Extract monthly Landsat and Sentinel-2 surface-water area.
- 03
Validate
Compare water indices and retain MNDWI using cross-sensor agreement.
- 04
Model
Benchmark statistical and machine-learning forecasts chronologically.
- 05
Communicate
Publish forecasts, uncertainty and explicit limits for decision support.
Cross-sensor validation
Why MNDWI was retained
Across 73 valid Landsat–Sentinel-2 overlap months, MNDWI produced MAE 3.463 km², RMSE 6.838 km² and bias −0.967 km².
Research boundaries
Clear limits make the evidence more useful.
The platform reports what the implemented evidence supports and avoids claims the available observations cannot validate.
Area is not volume
Depth, bathymetry, sedimentation, releases, abstraction and measured storage were unavailable.
Validation is satellite-based
Cross-sensor agreement improves confidence but does not replace field observations or labelled ground truth.
Optical data have gaps
Cloud and coverage filters rejected 35.5% of monthly Landsat records.
Long forecasts are uncertain
Longer-horizon skill was weak and uncertainty appropriately widens through 2030.
No deep-learning claim
Only 196 months passed quality control and the longest continuous valid run was 23 months.
Scenarios are not weather
CMIP6 projections support stress testing; they do not predict exact monthly conditions or shorelines.
Open research
Inspect the evidence yourself.
Download the reviewed manuscript, operational datasets and decision-support reports used in this application.
PDF· ManuscriptResearch manuscript↗
CSV · Historical dataQuality-controlled analysis dataset↗
CSV · Forecast12-month operational outlook↓
CSV · ScenariosMonthly scenarios through 2030↓
CSV · ScenariosAnnual scenario summaries↓
JPG · Historical imageryAnnual reservoir contact sheet↓
JPG · Forecast imageryForecast extent contact sheet↓
GIF · Historical imageryAnnual Landsat timelapse↓
GIF · Forecast imagery12-month forecast extent animation↓
GIF · Central scenarioCentral spatial scenario animation↓
GIF · Dry scenarioDry spatial scenario animation↓
GIF · Wet scenarioWet spatial scenario animation↓
MD · Technical reportFinal research report↓
MD · BriefingDecision-support report↓
MD · Technical report2030 projection report↓